Multi-Purpose Reports
By David Swain
Polymath Business Systems
We ended the last article of this
series having modified the value of a property of an object inside
a report instance from within the $construct method of
that report. In this article we will take this many steps further,
reconfiguring a report and many of the objects held within it based
upon one or more parameters passed to the $construct method.
But this is more than an academic exercise - it has significant
practical value!
There are occasions when we need different report layouts for the
same set of data. This most often happens when we need to provide
both detail and summary versions of reports that perform subtotaling
at various levels. We'll consider the following problem for this
article:
In a sales tracking application for a chain of retail stores, one
of the reports we need to generate presents sales transactions for
a specific range of dates. These transactions are subtotaled by
store and by region. (For simplicity in this example, we will use
only Sales and Store tables with region being a field within the
store table. Such reports can become much more complex!)
Various people within the company need this information, but some
need the report to include all transaction details, while others
need only the totals by store and certain upper management people
want to see just a one-page overview summary by region. The same
records need to be gathered for any of these reports (because we
can only generate totals from detail record contents - that's where
the information is), but their layouts are entirely different (at
least, if we are concerned about the quality of presentation of
the finished reports).
Here is visually what I mean. A page of the detail report
might look like this:
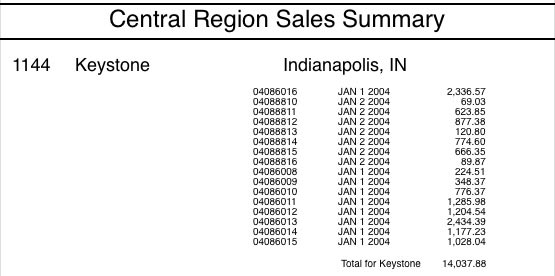
Here a regional manager or store manager can see the details of
transactions on a daily basis and accounting personnel can cross-check
this information against other sources. We could also generate other
statistics, like number of sales, average sale, minimum and maximum
sale, etc. if we needed to do so.
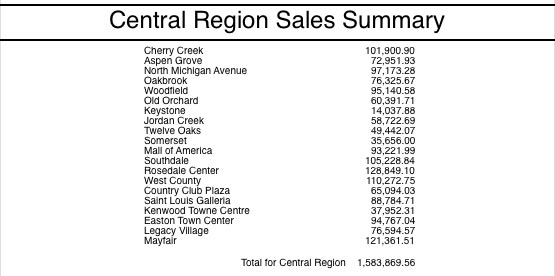
A page of the store-region summary would have a layout
that makes it appear the store totals are represented by individual
records rather than being summaries of many records:
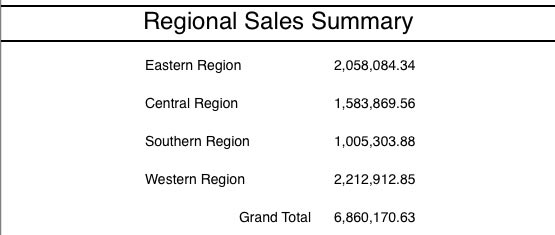
And finally, the one-page region-only summary makes it
look like the region totals are held as records in the database.
Note that we make the font size larger on this one both because
we have the room and so those upper level management people can
read them more clearly:
In earlier days we might well be tempted to create three Report
Classes and invoke the appropriate one from an external method that
manipulates the data and triggers the processing of each Record
Section. But we're using Omnis Studio now and we'd like to encapsulate
these various layouts and the data gathering into a single
Report Class for easier maintenance. These reports were generated
from such a Report Class, which we will build in this article.
To simplify this example so we can focus on only the layout changes,
we will continue to use native Omnis and allow Omnis Studio to perform
the data gathering tasks for us (which could include the use of
a Search Class for selecting a range of dates). But data gathering
is not our focus here. In a future article we will examine how to
include data gathering in our $construct method as well.
As mentioned above, there are two Files involved in this report:
a Sales File, which is connected to a Store File. The Store File
contains the Region information as a Short integer field
(0=Eastern, 1=Central, 2=Southern and 3=Western). With Sales as
the Main File of the report, we can use any field from either File
as a Sort Field. We will make storeFile.region be sort
level number 1 and storeFile.code (store number) be sort
level number 2. In the default (detail) version of the report we
will trigger both subtotals and a page break for any change on either
of these two variables.
But before we set about solving the rest of this problem, we need
to understand a few more things about Report Class objects...
Important Facts About Report Objects
Unlike objects on a Window or Remote Form Class, all objects on
a Report Class layout are equals in a sense. That is, they all belong
to the same group: the $objs group of the class/instance.
Omnis Studio makes no distinction between foreground and background
objects in a report - at least as far as Omnis Studio Notation is
concerned - even though they are selected from separate sections
of the Component Store. Neither Report Classes nor Report Instances
contain a $bobjs group. This has a few implications that
we will explore in this and future articles.
For example, we can assign names of our own choosing to "background"
objects in a report. The Property Manager does not allow this, but
we can do it through Notation. Why would we want to do this? One
reason might be that we need to modify one or more property values
of a cluster of similar objects (see the section on "Naming
and Configuring Report Background Objects" below) and it is
easier to use a naming convention to address the entire group using
$sendall() than it is to use the $ident values
(which may not fall in a contiguous range). This gives us greater
control over and flexibility with the process. When we perform such
name assignments, it is best to do them to the objects in the Class
so that the change is "permanent".
But something even more magical happens if we assign a name to
a background object in the class. Once a Report Class object has
a customized name, it appears in the field listing on the left side
of the Method Editor for that Report Class. This allows us to assign
methods to background report objects! We will not explore this intriguing
facet of report background objects in this article, but
expect to see a lengthy discussion on it here in the near future.
There are also some interesting facts regarding Sections of a report
of which we must be aware. While we may think of Sections
as "containers", Omnis Studio Notation does not treat
them that way in design mode. A Section banner is just another object
in the $objs group as far as the Notation is concerned,
although its $objtype value is kSection and it
also has a $sectiontype property. While Omnis Studio does
lay out all the objects in a Virtual Section first and then places
the entire contents of that Virtual Section onto the Virtual Page
as a unit, the Section banner itself functions more like a Repeat
loop than a container - programmatically speaking. Removing a Section
banner from a report layout does not remove all the objects
within the Section as would removing a tab pane from a window layout.
Every object, including every section banner, falls on a given
line in the report layout and has a corresponding value
in its $lineno property. We can change the location of
an object within the report by changing the value of its $lineno
property. Among other reasons, we would do this as part of a process
to add or remove lines from the report layout (since we can't directly
select a line using Notation and remove it or add another next to
it). Removing an object, like a section banner, from a report layout
does not remove the line on which that object once resided. We must
instead decrement the $lineno value of each object
on the report layout that has a $lineno value greater than
the line we wish to remove.
Armed with these facts, let's begin work in the $construct
method of our Report Class to allow it to be used for the multiple
purposes demonstrated above.
Naming and Configuring Report Background Objects
There may be some property values of some objects in our Report
Class that we need to change on construction of a report instance
no matter how the rest of the report is configured. For example,
I like to delineate the page header and footer in many of the reports
I create with bold horizontal lines that extend from the left margin
to the right margin. But if I draw such lines full size in the Report
Class, they often get in the way of making multiple field selections
- especially when I need to align fields in the body of the report
with fields in the header or footer. Sure, we can deselect the line(s)
from the group, but what a bother! I would rather that they just
weren't in the way while I'm performing other layout tasks.
So what we can do is to make our lines originally very short and
move them off to the side of the layout while we are in "design
mode". We can then use the $construct method to resize
and reposition all such lines when our report is instantiated. This
is easier to do in a single step if our lines are given similar
names.
To name these background objects, we can temporarily add some method
lines to any method in our Report Class. We will manually execute
these lines of code in a moment and can completely remove them when
the job is done if we wish, so it doesn't matter where we put them
for now. We will give all of our horizontal dividing lines names
that begin with "ext", indicating that we want to "extend"
them. If their $ident values are (from top to bottom) 1010,
1014 and 1022, then we would create the following method lines (Notice
that we address these objects in the class):

If we double-click on the first of these lines in the Method Editor,
a Go point indicator (triangle in the margin to the left
of the selected method line) appears indicating that this method
is currently in "execution mode". We can then step through
each line, executing them one at a time until all have been processed.
We then select the Clear Method Stack item from the Stack
menu of the Method Editor window to exit execution mode. This technique
causes the method lines to be executed in Design Space, but that
is OK since we only need to affect design objects in a class.
We can now either comment out or completely remove these lines since
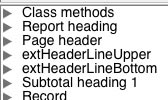
their job has been done. The list of report objects in the Method
Editor will now look something like this (after closing and re-opening
the Method Editor to force a redraw):
In our $construct method, we can now add the following
lines of code to extend these lines when the report is instantiated:

We add the local variable pgwidth (Number floating
dp data type) and assign it a value so that the calculation
only needs to be executed once. Notice that the $sendall()
method is actually performing two operations for each object: setting
the $left property value to 0 and setting the $width
property value to the width of the page inside the margins. Also
notice that this composite message only applies to objects whose
$name property value begins with the string "ext".
But this is just the beginning of what we can (and must) do in
this example. Let's move on to the more important items...
Needs of the Project
Let us now consider the needs of the three configurations for our
report. We need a detail report, a summary by store
and region and a summary by region alone. The first
thing we need is a parameter variable for the report's
$construct method that indicates which configuration the
current instance is to use. We will name this variable summaryLevel
and give it a Short integer data type. A value of 0 will
invoke the detail version, 1 will indicate the store-and-region
summary and 2 will launch the region-only summary.
We will set a default value of 0 for now and change this as we work
on our code to force the different summary levels without having
to pass the parameter value from an outside method. Once this report
is deployed in our application, of course, any parameter passed
to the report will override our default.
We will set up the detail view as the base report configuration.
This allows us to test whether the proper records are being gathered
and that the proper sorting is taking place, etc. Our two levels
of subtotal are set up as shown here:

The complete Report Class layout looks like this:
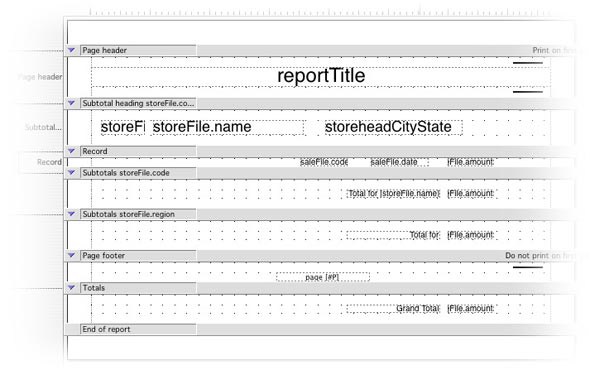
The reportTitle field in the header is a calculated
entry field with a text value of
con(pick(storeFile.region,'Eastern','Central','Southern','Western'),'
              Region Sales Summary')
The field named storeheadCityState also combines the city
and state values using the con() function. The
section just above the Record section is the Subtotal Heading 2
section. Note that we are not using a Subtotal heading
1 section because our Page Heading section serves that function.
The Record section contains fields to display the transaction code
, sales date and amount values from the saleFile record.
Other than date formatting, there is nothing special done in any
of these fields. They are deliberately put over to the right a bit
to simulate their positions in a more complex report that could
have more detailed information. While the amount fields
in the Subtotal and Totals sections must line up directly beneath
their sister in the Record section, we may want to move them in
the other configurations where the Record section does not appear.
In each of the aggregate sections there are two fields. The field
on the left is a text (background) object that uses square
bracket notation to display the proper store or region name in the
Subtotal sections. For better layout in the detail view, these objects
are right justified. The field on the right represents the saleFile.amount
variable with a totalmode value of kTMTotal. Each
of these fields is also right justified so that the decimal
point in its contents is aligned with those of its sister fields
in the sections above and/or below.
If we print this report as it is, we will get results like the
first report we saw in the introduction above.
OK, what must change in this configuration to make a good-looking
report at the summary levels? First, for either of them we need
to set the repeat factor of the report instance to 0. This
is the number of times the Record section contents are placed on
the Virtual Page that is eventually sent to the printer. When the
repeat factor is set to 0, the Record section is not printed - but
it is still processed, which sets this apart from other techniques
for suppressing the printing of that section. This means that our
totals will be properly accumulated.
For the store-region summary, we no longer need or desire
to trigger a new page each time the store code changes. We now want
as many stores as possible to appear on the same page (as long as
they belong to the same region). In fact, we also don't want the
Subtotal heading 2 section to print (the Subtotal heading 2 section
needs to be removed along with all objects inside of it) because
the fields in the Subtotal level 2 section are sufficient to identify
each store - and the subtotal we want to display is already there!
But these fields still need to be reconfigured so that they are
more centered on the page - and the label field on the left would
look better if it were now left justified. The Subtotal
level 1 and Totals section fields need to be moved in a corresponding
way. Making these changes should result in the second report we
saw in the introduction.
The region-only summary needs the same changes as the
store-region summary, plus a few more. For this reason,
we are nesting the region-only enhancements inside
the store-region modifications. In addition to the modifications
listed above, the region-only summary requires that we
remove the inner subtotal level completely, rework Subtotal level
1 as we did with Subtotal level 2 above and rework the Page heading
section content a bit to show a more generic page title.
By the way, I am using inches rather than centimeters
for the measurements in this article. Just thought you should know...
All right, then. Let's get out our checklists and begin the notational
surgery!
Basic Needs
We know that any summary report needs its $repeatfactor
property value changed to 0. We also know that a parameter will
be passed to indicate this. So a good place to begin our $construct
method is to test for a non-zero value of summaryLevel
and set the $repeatfactor value based on this (its default
for $repeatfactor in the class is 1). We also know that
the region-only summary incorporates all the changes from
the store-region summary, so we can build this structure
while we're at it:

Of course, we need to flesh this out quite a bit, but this is the
conditional relationship for the rest of our code.
We will also find it useful to name the text objects that
act as labels in the subtotal and totals sections as well as the
fields used to report the various levels of subtotal for saleFile.amount.
We will name the items in Subtotal level 2 with a string that begins
with "sub2", use "sub1" as a prefix for object
names in Subtotal level 1 and "tot" for the objects in
the Totals section. For consistency, we will use "label"
and "amount" to complete the names of the appropriate
objects. In the same way, we will use the string "storehead"
as a prefix for the names of the fields in the Subtotal heading
2 section.
Since the text objects must have their names assigned
using Notation, here are the lines of code I used in my example.
You may need to change the $ident values for your own version:

Now for the next item...
Modifying Sort Field Property Values
The next thing we must do is to eliminate the automatic page break
on a change of storeFile.code value when we are printing
a summary report. We do this with a simple calculation to set the
value of the $newpage property of the second sort field:

Since we know that we want to perform this same operation on the
level 1 sort field for our region-only summary, we may
as well do that now too by simply copying and pasting and then changing
the 2 to a 1. But we need to perform another sort field modification
for the grand summary: we need to switch off subtotaling for sort
level 2. This means changing the $subtotals property value
to kFalse for that level. Once we do so, our code will
now look like this:

The order in which we perform this change relative to other modifications
we make doesn't matter. It is only important that these changes
be made before any records are processed.
But we are still subtotaling on level 2 in the store-region
summary. Printing both the Subtotal heading 2 and
the Subtotal level 2 sections won't look very good, though, so let's
remove the Subtotal heading 2 section...
Removing Report Objects
This gets a bit tricky in the case of removing sections because
the objects that were included in that section now float up to the
section above. In our case, the fields that were in the Subtotal
heading 2 section will become part of the Page heading section.
This is not what we want, so we must remove each of those items
as well. And the $sendall() method does not seem to allow
the $remove() method for the group on which it operates
to work inside itself, so we must remove these items individually.
(I would be happy to be corrected - with working examples - on this
point!)
It is far easier to have all the objects required for the most
complex form of our report included in the class and "fully
loaded" with property values and methods and then to remove
those that are not needed for a specific configuration than it is
to build a number of fields and populate them with the necessary
items dynamically. For this reason, we will only discuss removal
of items in this article.
To remove an item from a group, we use the $remove() method.
In a report layout, the only group involved is the $objs
group for that report instance. The $remove() method requires
as its single parameter a notational reference to the exact item
to be removed. So to remove the Subtotal heading 2 section we would
execute:

We remove the objects that were in this section in the same way,
just substituting their names for the name of the subtotal heading
section and using one line of code for each object. But this leaves
a big group of empty lines. What do we do with those?
Removing Report Layout Lines
Removing a line in a report layout is easy. We just reduce by 1
the $lineno value for each object that has a line number
greater than the line we wish to remove. Doing this using $sendall()
performs the operation in object number order (order within
the $objs group is by line and position on a line, not
by $ident), so the End of report section is moved
up last. If the objects on this line have not been removed, they
are simply joined by the objects from the line below. But since
we only want to move lines up that were below the section we removed,
we need to do a bit more work...
Before we remove the section banner, it is a good idea to remember
what line number in the report layout this section banner resides
on. That way we can remove the empty line(s) that remain after the
section banner and objects have been eliminated. So let's create
a local variable named linenumber of Short
integer data type (assuming we will have fewer than 255 lines
in the report layout) and use it to capture the $lineno
value for the subtotal heading before we remove it. We can then
use that variable to determine which objects in the report need
to be scooted up a notch (in this case, 4 lines) after removing
all the now-unnecessary objects in this section. After doing all
of this, our code will look like:

This block of code then removes the entire section, lines and all!
Adding a line is a different matter. In this case, we
need to make room for the line first by incrementing the $lineno
value of the End of report section by 1 and then doing
the same for all items with line number values greater than or equal
to the one we want to insert - except for the End of
report section, which has already been moved down. Fortunately,
we don't need to add lines to the report in this example.
We can add or remove more than one line at a time too as was shown
in this example. We just increment or decrement those $lineno
values by some integer value other than 1. The main thing we need
to be careful of is not trying to set a negative or 0 $lineno
value or one that is greater than or equal to the $lineno
value of the End of report section.
Cosmetic Surgery
Now we just need to clean up the layout a bit. First for the store-region
summary report: In the Subtotal level 2 section, we now need
the contents of each iteration to line up nicely with with those
of the other subtotal sections at the same level - as if they were
Record sections. To this end, we want to left justify the
label and pull both fields to the left to better center the contents
on the page. This can be done with either careful measuring and
arithmetic or a bit of experimentation (whichever works best for
you). We also want to change the contents of the label itself, because
line after line of "Total for <store name>" looks
pretty bad. If these are to look like record images, then the store
name should stand alone. So we need to modify the $text
property value and set it to "[storeFile.name]"
(note the square brackets in this case).
We should also tighten up the spacing a little (a nip here, a tuck
there). When this was a subtotal section that followed a bunch of
record sections, we needed some space to set the subtotal off from
those record images. Now that this section is acting like a record
section, the extra spacing looks bad and wastes space on the page.
So we should move the fields whose names begin with "sub2"
(remember our naming convention) up one line and we should move
all the objects lower down the page up two lines.
To know which fields those are, we need to use our linenumber
variable again, this time capturing the $lineno value of
the sub2amount (or sub2label) object after
it has been moved up.
Finally, we should bring the contents of the other aggregation
sections into line horizontally with Subtotal level 2 objects. The
"amount" field should be directly beneath the one in our
primary section and the corresponding "label" field should
be just to the left of that. We don't want those labels directly
below the one in Subtotal level 2 because they would "blend
in" with those pseudo-record lines and make the report less
readable.
The code for this store-region summary cosmetic surgery
is as follows:

Anything Special for the Region-Only Summary?
I'm glad you asked! We have already dealt with the changes to the
Sort Field properties, but these have certain implications that
we must still accommodate. Then again, there are some pleasant surprises...
The main (and most pleasant) surprise is that since subtotaling
is no longer triggered for this report on sort level 2, the subtotal
level 2 section will not print. This simply means we don't have
to remove it to keep it off the printed page! Every so often we
get a break...
But there are other considerations. First, the string displayed
in the reportTitle field in the Page header section is
no longer appropriate. Showing the name of the current region worked
for both the detail report and the store-region summary
since a change in region triggered a new page. Now all our regions
are on one page! Since this is a calculated entry field,
we must change the $text property value to something more
appropriate. Let's change it to "Regional Sales Summary".
But since the $text property value is treated as an expression,
we must remember to include quotes in the value placed
there. So our calculation must use two nested sets of quotes
- one single and one double (the order does not
matter here). We could also use the con() function and
either kSq or kDq to add single or double
quotes to the string value.
Next, we need to modify the sub1label object in a similar
way to how we modified the sub2label object for the store-region
summary. We need to move it further to the left, make it left
justified and remove the "Total for " string from its
contents.
Finally (yes, really this time), we wanted to make the font size
a bit larger to ease eye strain on the upper management people who
will receive this report. To prepare for this, we should also move
the totlabel field a little to the left as well (to accommodate
the larger space required by the totamount field). We can
then use $sendall() to set the point size of all fields
in the Subtotal level 1 and Totals sections to 14. The final code
for the region-only enhancements is then:

Was it Worth It?
I leave the answer to this up to you. I personally find this much
more worthwhile than making multiple Report Classes for the same
data. It isn't really that much code (33 lines for this one - with
comment lines removed), it executes quickly and is easy to maintain
(especially if well commented in-line). It just requires a little
planning and analytical thought.
Next time we will consider including data gathering methods in
the $construct method of a report. This could get interesting!
|